Saturday, February 29, 2020

BID MATH - 02/29

As the Regular season begins to draw to a close, a picture of the teams that are in, or on the bubble is coming into clearer focus.  Smaller conferences will wrap up play this weekend and begin their conference tournaments starting next week.  Larger conferences have just 2-3 games remaining in their regular season schedules and will conclude regular season play by next weekend.  Selection Sunday is now just 15 days away.


Here is the breakdown of where the field stands, through games played on Friday, February 28th

First a refresher on how the field is constructed and definition of terms used in 'Bid Math':

  • Total Field Size is 68 Teams
  • Conference Champions:  32 Teams Qualify for the Tournament by winning their conference tournament.
  • At-Large Selections:  The 36 Remaining spots in the field are chosen by the NCAA Selection Committee and are intended to be awarded to the 36 Non-Conference Champions who the Committee determines have done the most through the season to be selected.
  • Definition of Terms:
    • Conference Leaders - Teams who are currently in first place in their respective conference, and would be considered the 'Favorite' to win the tournament and earn the Automatic Bid.
    • At Large Locks - A team which has done enough already to be assured of being awarded an At-Large Bid even if they failed to win their conference tournament.
    • Bubble - Describes the universe of teams who have done enough to warrant consideration for inclusion as an At-Large Team, but have not done enough to guarantee they would be selected
      • Bubble Team In - A team that is projected to be an At-Large Team if the tournament field were selected today
      • Bubble Team Out - A team that is projected to be left out of the field if it were selected today, but still have an opportunity through remaining games to be played to earn a spot
    • Bid Thief - A team that has not done enough to earn an AT-LARGE bid, but earns an automatic bid by winning a conference tournament in a multiple bid conference. 

The Current Math:

  • Conference Leaders (32)
    • 9 Are AT-Large Locks if they don't earn Auto-Bid
    • 3 Are Bubble Teams (IN) if the don't earn Auto Bid
    • 20 Are Leading One Bid Confernces
  • At-Large Locks (11)
  • THE BUBBLE:
    • Remaining At-Large Bids ( 25)
    • At Large Teams on the Bubble (33)
    • Possible 'Bid Thieves' (11)
    • Bubble Size - 14-25 Open Slots
Under this projection there are currently 36 Teams (33 At-Large plus 3 Conference Leaders who have not locked an At-Large Bid) in contention for at most 25 remaining At-Large Bids.  A detailed break down of how the field is comprised can be found below.

Status of Current Conference Leaders 
The teams below are currently leading their conference.  They are broken down into 3 Groups:

  • LEADERS with AT-LARGE LOCKS - These teams lead their respective conference and would be the favorite today to win their conferences Automatic Bid.  However, if they don't, they have done enough already to guarantee they would be selected as an At-Large team.
  • LEADERS "ON THE BUBBLE" - These teams lead their respective conference and would be the favorite today to win their conferences Automatic Bid.  However, if they don't, they likely will have to win more games to have done enough to get selected as an At-Large Team.
  • LEADERS of 'ONE BID' CONFERENCES - These teams currently lead in Conferences that do not have any teams who have done enough to be selected as an At-Large.  These Conferences will only get 1 Team in ... their Conference Tournament Champion.


AT-LARGE LOCKS (11)

The teams below are currently not leading a conference.  They have done enough to guarantee being selected as an At-Large Team even if they don't win their conference's Automatic Bid

THE 'AT-LARGE' BUBBLE

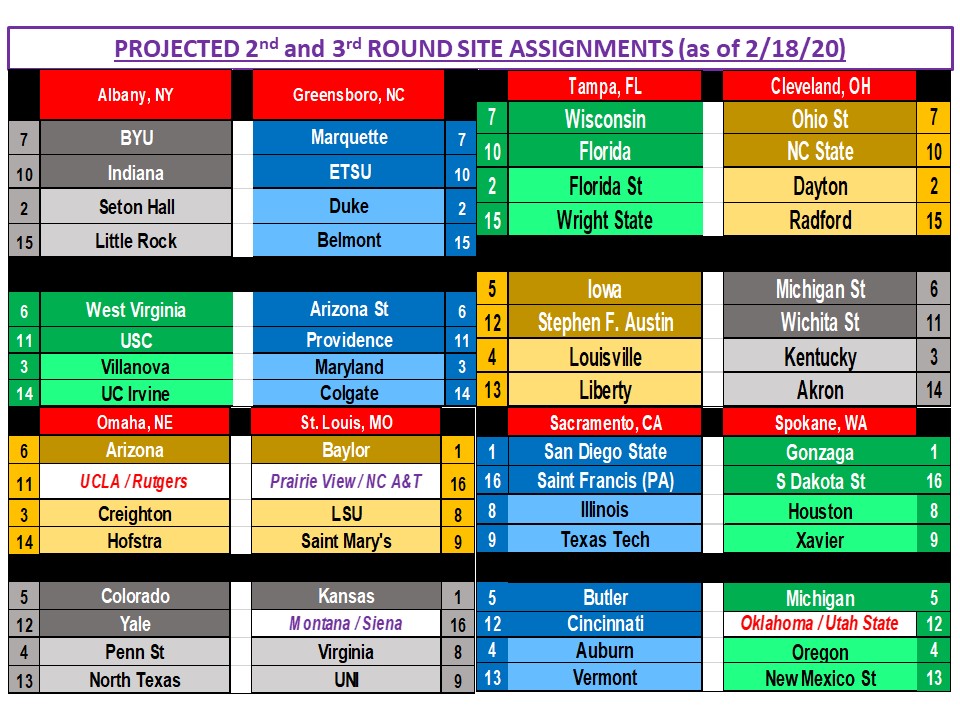
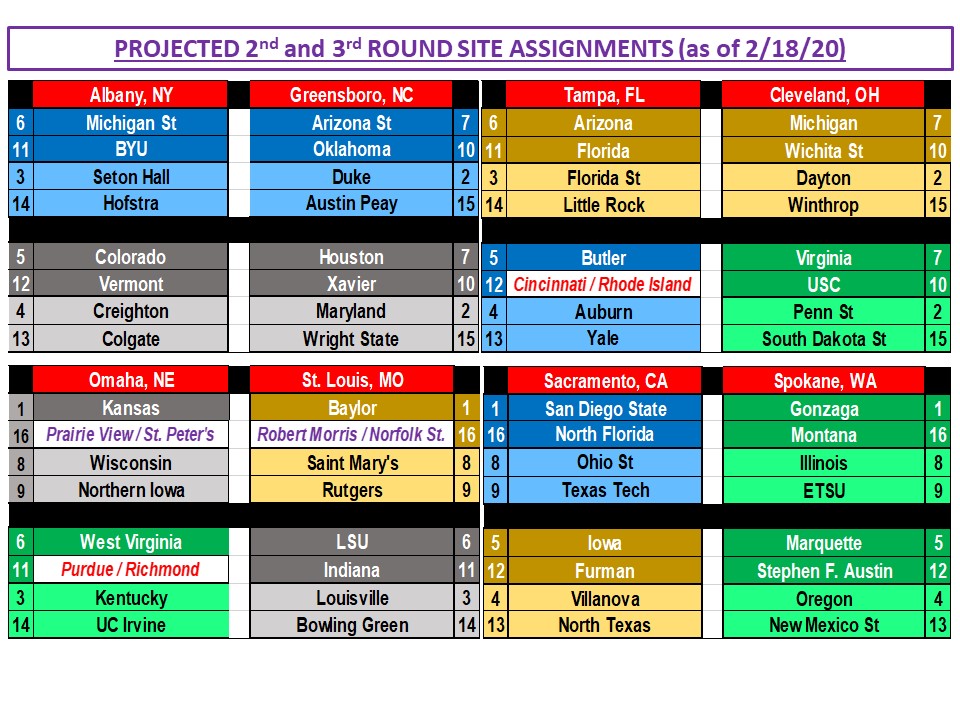
The teams below are the remaining teams in contention for the remaining open At-Large Bids.


  • Teams on the LEFT would be IN if the season ended today.
    • Teams shaded in GREEN above are the Last 4 At-Large Teams selected that are given a 'BYE' and would not have to play a 'Play-In' game in the opening round in Dayton on March 24th or 25th
    • Teams shaded in YELLOW below are the Last 4 At-Large Teams selected, and would be required to 'Play In' to the field of 64 by winning an opening round game in Dayton.
  • Teams on the RIGHT would be OUT if the season ended today.
    • Teams shaded in ORANGE are the first four teams left out of the field, and are therefore, in the best position to still earn an at-large bid by winning, and/or teams ahead of them losing
    • Teams shaded in MAROON are the next four teams out.  They are still in contention to earn an at-large bid, but have more work to do, and will need more help, then the first four out.  
    • Teams shaded in Blue and Pink are still under active consideration, or are 'on the radar', for consideration.  These teams are in most cases just one more loss away from being eliminated from contention, but could, if everything broke right for them, get back into serious contention for an At-Large Bid. 

Friday, February 28, 2020

Full Bracket Projection - 02/28

Below is February's final full bracket projection which includes results from games played through Thursday, February 27th.

Two new teams appear in the field from the last week as a result of taking the lead in their conference standings:

      • Bowling Green has retaken the lead in the MAC Conference
      • Northern Colorado is selected from the 3-way tie atop the Big Sky Standings based on best NET Ranking.


Biggest Movers in the field from last Monday:

  • Wisconsin moves up 6 spots on the S-Curve and a full seed line following their Q1a Road win at Michigan last night.  The Badgers have now won 5 straight, are 11-6 in the Big Ten and in a 4 way tie for 2nd behind Maryland.
  • West Virginia drops 5 spots on the S-Curve and 2 Seed Lines after losing at Texas this week.  The Mountaineers have lost 5 of 6 heading into the final 3 regular season Big 12 games of the season.


Monday, February 24, 2020

Full Bracket Projection - 02/24/2020

I put this together this morning and forgot to post.  It's my latest full bracket projection along with 2nd and 3rd Site assignments, Seed List and Seed/Rank Compare to last week.  This is through all games played Sunday, February 23rd.  It's updated from what was posted yesterday, but already somewhat obsolete given Monday night games are already underway.


Sunday, February 23, 2020

Seed List and Field Ranking - 02/23

It's been a fascinating week of Men's NCAA Basketball, as reflected in my most recent seed list and field ranking (or S-Curve).   You can find the listing below the analysis below.


Here are a few of the more intriguing stories from the past week:

  • Entering play on Saturday, 3 of the projected #1 Seeds (Baylor, Gonzaga and San Diego State) entered play a combined 77-2 on the season.  On Saturday, they went a combined 0-3.  Despite those 3  #1 seeds losing, each remains on the 1 Seed line.  Baylor remains the #1 over all, but Kansas closed the gap by beating Baylor, at Baylor.  Each has beaten the other at their place.  The difference?  Baylor is 10-1 against Quad 1 opponents and 6-1 against the top tier of Quad 1.  Kansas is 11-3 and 7-3 respectively.   Would love to see the matter settled with a rubber match on a neutral court in the Big 12 Tournament title game.
  • It was a roller coast week for teams on the bubble.  Three teams who were not in the field charged in this week from seemingly no where.  
    • UCLA:  Just a couple weeks ago the Bruins were floating around .500 in the PAC 12 and were sitting around 100 in the NET rankings and not even being discussed.  That was just before a starting a 5 game winning streak started with a huge road win at Arizona and culminated in dramatic fashion yesterday with a come from behind win at then PAC 12 Leader Colorado.  The Bruins are now 10-5 in the PAC 12 and just a half game behind this weeks new leader, Arizona State.  They have moved up 22 spots in the NET Rankings, and are now in my projected field as one of the last 4 in.  With 5 Quad 1 wins, including 3 against the NET Top 15 (2 on the road) and 2 more Q1 games remaining, and match-up Thursday against Arizona State at home, they have an opportunity to continue the meteoric ascent.
    • Providence:   Entered February on a 3 game losing streak and sitting at .500 in the stacked Big East Conference, but a brutal schedule ahead of them, and carrying 4 Quad 3/4 losses from November.  After two big wins to open the month at Butler, and at home over Creighton, they started showing up on some people's watch lists.  They then dropped 3 straight games, fell below .500 in the conference, and again fell of the radar.  Since then though, Since then they have beaten conference leader Seton Hall, fellow bubble team Georgetown on their home floor, and completed a season sweep of Marquette.   With the help of a number of bubble teams imploding during the same time, Providence has surged into the field with a hard to ignore 7 Quad 1 wins, including 3 against the top tier, and two of those, on the road.
    • NC State:  NC State had been hanging around the outside of the field for a couple weeks.  Straddled with an unusually weak ACC Conference beyond the top 3 teams, and lacking a signature win,  the Wolf Pack was finding it hard pressed to crack the field against teams getting more opportunities to get Q1 wins.  That all changed this past week when NC State hammered Duke by 22 points.  With their first Q1 win against a NET Top 10 team, and 5th Q1 win overall, NC State finally had the signature win they needed to get into the field.  While they failed Saturday to extend the moment when they lost at home to Florida State, the imploding bubble below them kept them in the field this week just one spot away from being one of the Last 4 In.
  • Related to the unforeseen rise of the teams above into the field was an implosion of teams right above and below the bubble cut line.  Here are a couple of the more compelling examples
    • Purdue One of the most schizophrenic teams I have seen this season.  They have blown out tournament level compeition like Michigan State (by 29), Iowa (by 36) Virginia (by 29) and Wisconsin (by 19).  Yet were only 14-12 heading into a crucial week this week and went on to lose at Wisconsin and then at home to Michigan, dropping them to 14-14 overall and 7-10 in the Big 10.  They aren't dead yet, but one more conference loss likely puts them in a position of having to win the Big Ten Tourney to get in.
    • Georgetown snuck into the conversation, and some people's projected field (including mine) after last Saturday's huge road win at Butler, and losses by Arkansas, Purdue and Minnesota.  They then proceeded to lose back to back games this week to fellow bubble team Providence on their home floor, and at DePaul yesterday.  Georgetown now finds itself with 10 Quad 1 losses, and 4 games below .500 in the Big East.  They still have chance to get back in the discussion, with 3 Quad 1 games remaining.  But they will likely have to run the gauntlet of winning at Marquette Wednesday, then at home against Xavier, at Creighton and home against Villanova.

Tuesday, February 18, 2020

Full Bracketed Field Projection - 02/18/20

Every couple of weeks or so I will do full blind re-scrub of the teams under consideration.  This will result in some changes to the field, and that was the case this week.

After fully scrubbing the field this morning Penn State, Creighton, Michigan and Arizona all made at least 2 Seed line jumps up on the seed list.

Sliding down at least 2 seed lines or more were West Virginia, Illinois, Bowling Green and Winthrop.


Sunday, February 16, 2020

Seed List and Ranking of Field - 02/16

Here is the my current rankings and true seed list of the full 68 team field, plus the next 12 outside of the bubble and looking in through all games played Saturday, February 15th. 


Monday, February 10, 2020

First Full Bracketed Projection - 02/10/20

Today I am releasing a full update which includes a full bracket projection, created following NCAA Seeding and Bracketing guidelines.

This update is complete through games played Sunday, February 9th and does include some changes from the Seed List published yesterday.


Sunday, February 9, 2020

68 Team Tournament Field Projection - 02/09/2020

Here is my first full field projection list for this year's NCAA Men's Basketball Tournament.  Included in this release are the Top 4 Seeds in each Regional, assigned according to NCAA Bracketing Principles.  This is based on all games played through Saturday, February 8th.

Also included is a listing from 1-68 of the teams I am projecting would be in the field if it were selected today.

Finally, I have included the 12 Teams on the outside looking, in ranked order from 69-80.

As a caveat, this is a projection of what I feel the NCAA Selection Committee would do, not necessarily what I would do if I was the selection committee.

What is not included today (But may be by tomorrow morning) is bracket, with teams placed according to bracketing principles.  Future updates typically will include this, and can sometimes lead to seedings that vary from the S-Curve.  However, the Badgers are on in an hour and I have run out of time this morning.


Saturday, February 8, 2020

Top 16 Seed Projections - 02/08/20

Today at 11:30 AM CST, the NCAA Selection Committee will release the Number 1 through 4 Seeds through games played on Friday, February 7th.   Its a view from the committee of the top 25% of the field if the committee had to announce its brackets today.

You can read more about it here: Selection Committee To Reveal Top 16 Teams as of 02/08

The NCAA Selection Committee has been giving this early preview of how they are evaluating top teams for a few years now.  I haven't published a full bracket projection prior to this reveal in past seasons.

While this year will be no different in regards to the reveal of my first full bracket of 68 Teams, I thought I might try something different this year and reveal my Top 16 in advance of the Committee to see how my current evaluation stacks up against the Committee so far.

Below are my 1 Through 4 Seeds, by Regional Assignment, and placed there according to NCAA Bracketing Principles (I have a link on the right hand margin which provides the official NCAA Bracketing Principles and Guidelines).  Also included are my current Top 20 teams on the S-Curve.

I believe the NCAA will provide a ranked list, from 1-16 and should answer some questions about how this particular committee may evaluate teams as we head towards selection Sunday.  Some things I will be interested to find out:

  • How will it rank Gonzaga compared to San Diego State?  Right now I have Gonzaga ranked above SD State by the slimmest of margins ... two better road or neutral court wins.  I will acknowledge though, that their loss to Michigan on a neutral court is starting to look worse with each passing week that Michigan slips in the NET rankings.  SD State remains unbeaten.  Which team gets ranked higher may give us a good idea of just how much weight the Committee is going to place on the NET in gauging Quad 1 wins.
  • How does the committee use the NET to sort out the top teams from PAC 12, and which teams, if any, crack the top 16?  I'm a bit mystified by the high NET ranking of Arizona (8).  Colorado (18) and Oregon (19) seem to me to have much better resumes.  Arizona, Despite being 2-4 against Quad 1, 0-3 against the top tier of Quad 1 teams which I call 'Quad 1a', and losses on a neutral court to St. John's (72) and at Oregon State (82), are ranked 10 spots higher in the NET than PAC 12 Leader Colorado and the team from the conference that I think has the best overall resume' to date in Oregon.  The Ducks are 6-3 vs Quad 1 teams, 3 of which are against Tier 1a teams.  They have a neutral court win over Seton Hall, and beat Arizona at home earlier this year.  If Arizona shows up in the top 16, ranked higher that either Colorado or Oregon,  it would suggest that NET Rankings are carrying more weight with the Committee than actual wins and losses in the top quads.
  • Dayton, similar to Arizona, is valued highly in the NET, ranked 5th but the basis for it is difficult to understand.  They do have a gaudy 20-2 record, but the resume' seems thin as I dive deeper.  They are the only team among my top 8 without a win against a Quad 1a tier opponent. Their best wins are on a neutral court against St. Mary's (33) and on their home court against VCU (32), who I have out of the field as of today with an S-Curve ranking of 73.  In fact, looking at the resume', St.Mary's is likely the only team they have beaten that I would expect in the field right now, and I have them as just a 7 seed.  Others have them even lower than that.  They have lost to every other team that I think is in at this point.  I have them as a #2 Seed today (barely) based on overall record and top 5 NET rating.  Can a team with only a single win against a  team that is probably no higher than a 6 or 7 seed today really be seriously considered for the 2 line?  Frankly, they look more like a 4 or 5 seed to me right now.  Where they land with the committee today should tell us something about how they evaluate wins against other teams in or under consideration for the field versus their overall record and NET ranking.  
  • Auburn, by the way, has a very similar looking resume' to Dayton, has a road win against a Quad 1a opponent, but is ranked 12 spots lower at 17 in the NET.  Where these two teams land in the top 16 relative to each other will be revealing as well.
UPDATE:
 
The NCAA completed their top 16 Reveal a few minutes ago, and here is a quick look at how I did:
Quick Analysis:
  1. 10 of 16 Teams on the correct Seed Line
  2. 15 of 16 Teams within 1 of the Correct Seed Line*
  3. 5 of 16 Teams Ranked Correctly
  4. 12 of 16 Teams Ranked correct or within 2 Spots of NCAA Ranking*
  5. Missed 2 Teams in Top 16 (West Virginia, Michigan State instead of Penn State and Kentucky)
  6. Biggest Miss: West Virginia - 10 Ranks Spots/ 2 Seed Lines
* Committee Chairman indicated that LSU, Kentucky and Iowa generated the most discussion for inclusion in top 16.  Leads to assumption they were ranked in the 5 Seed line, and therefore counted Kentucky, who I included in top 16 as a 1 Seed Line Miss and 2 or less rank spots.

As I noted earlier, how the committee treated Dayton was going to be revealing.  They obviously think very highly of them despite the thin resume on wins over Quad 1 teams.  In looking at other metrics the committee appears to be relying upon beyond the NET ranking, Dayton and West Virginia both rank in the top 8 in efficiency metrics as ranked by Ken Pomeroy, at 6 and 7 respectively.  Auburn, who has similar, if not better resume in terms of quality of wins is ranked 29th by comparison in the Ken Pom rankings.  Seton Hall, who I had as the top 2 Seed, and ranked 5th overall is 13th in efficiency rankings.  To be honest, I think that is good thing.  I believe the Ken Pomeroy metrics to be among the very best in measuring team performance, especially when you have disparate schedules or resumes to try and compare.

Biggest shock to me was Michigan State being included given the quality of play recently.  Penn State just beat them this week, has a 6-3 record against Quad 1 (Michigan State is 3-6), are 10-4 against Quad 1&2 (Michigan State is 8-7) and 5-3 in Quad 1 & 2 games on Road or Neutral Courts (Michigan State is 3-5).  That to me was a big miss ... and could have made equally compelling cases for including Kentucky, LSU, Iowa or Colorado instead of Michigan State.  Again, it appears the Ken Pom rankings factor in heavily here.  Michigan State entered play today ranked 9th in efficiency.  Where I differ on this one though, despite my affinity for Ken Pom rankings, is that in my opinion, Michigan State just isn't winning enough against the best teams it plays.

It's That Time of Year Again!

Greetings fellow NCAA Basketball Bracketology fans and nerds.  It's that time of year again.  That time when College Basketball fans start turning their attention to the NCAA Men's Basketball Tournament, and start to try and figure out which teams are on their way to a bid in the big dance, which ones are on the bubble to get in, and where they may ultimately get seeded should they get in.

This has become an annual endeavor for me dating back to the 2006-07 season.  It all started for me when I was becoming increasing frustrated as a Wisconsin Badger Fan by projections of a team that looked to me when watching them to be worthy of the programs first #1 seed continuing to get projected as a #2 or #3 by pundits and prognosticators leading up to selection Sunday.  So I opened up EXCEL, starting plugging data of what were generally considered to be the top 16-20 teams into a spreadsheet, and started analyzing the data to see what in the world I was missing.  The more I analyzed, and tried to develop algorithms and formulas for sorting and ranking, the more teams I kept adding to the spreadsheet, until I found myself trying to figure out not just where Wisconsin would get seeded, but which teams would get in, which ones would be left out, and what I thought the seeds of those teams should be.  I did miserably, as I recall.  I know I still felt like going into the Selection Show that Wisconsin had earned a #1 seed, and they wound up a #2.  I was convinced the committee had completely blown it ... at least until Wisconsin was upset in the Round of 32 by #7 Seed UNLV.

That exercise hooked me though.  From that point on, every year (except 2018) I have gone about the same exercise, and a few years ago, started sharing my projections on this site, and submitting to the The Bracket Project as a way of measuring my projections against other geeks like me across the county.  Generally speaking, its something I have slowly gotten better at with each passing season (though my results last year suggest regression).  I'm no expert, and don't claim to be.  However, I would argue I'm as good most years as the Joe Lunardi's and Jerry Palm's of the world who are paraded out every day in March on ESPN and CBS Sports respectively as the resident experts on who is going to get in, who is going to get left out, and who's going to be seeded where.  It's actually not something to brag about ... those guys are outperformed consistently year in and year out by dozens of people at the bracket project.  But, I would argue you can get just as good analysis from me most years as you can from them.

So thanks for stopping in, or stopping back, and checking things out as we get ready to embark on another season of this.  I hope you find the content interesting and thought provoking.